College Going/College Eligibility CA GEAR UP Data

The following figures show GEAR UP schools’ academic outcomes and college going and eligibility rates (e.g., A-G course requirements, FAFSA submission and completion, high school graduation, and college application, admission, and enrollment) from the 2017-18 academic year through the 2021-22 academic year. It is important to note that these figures include rates observed during the COVID-19 pandemic. The COVID-19 pandemic had a significant impact on students nationwide, including those in GEAR UP schools. Although academic outcomes and college going and eligibility rates declined for some indicators during the years impacted by COVID-19, this pattern was observed in many schools across the state of California and is not unique to GEAR UP schools.

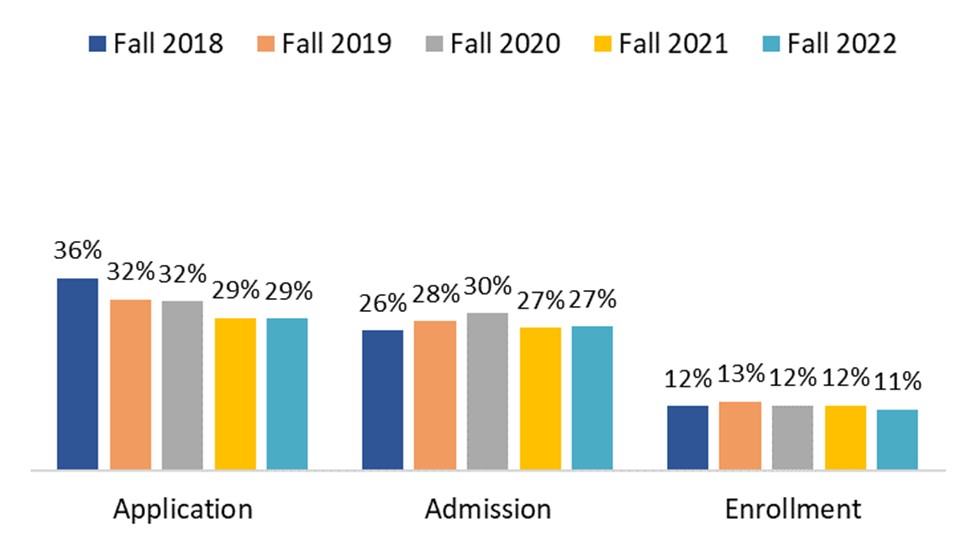
GEAR UP High Schools’ CSU Application, Admission and Enrollment Rates

Three bar charts, each with values for Fall 2018, Fall 2019, Fall 2020, and Fall 2021. The application chart's percentages were 37% for 2018, 32% for 2019, 32% for 2020, and 28% for 2021. The admission chart's percentages were 27% for 2018, 28% for 2019, 29% for 2020, and 26% for 2021. The enrollment chart's percentages were 9% for both 2018, 9% for 2019, 11% for 2020, and 9% for 2021.

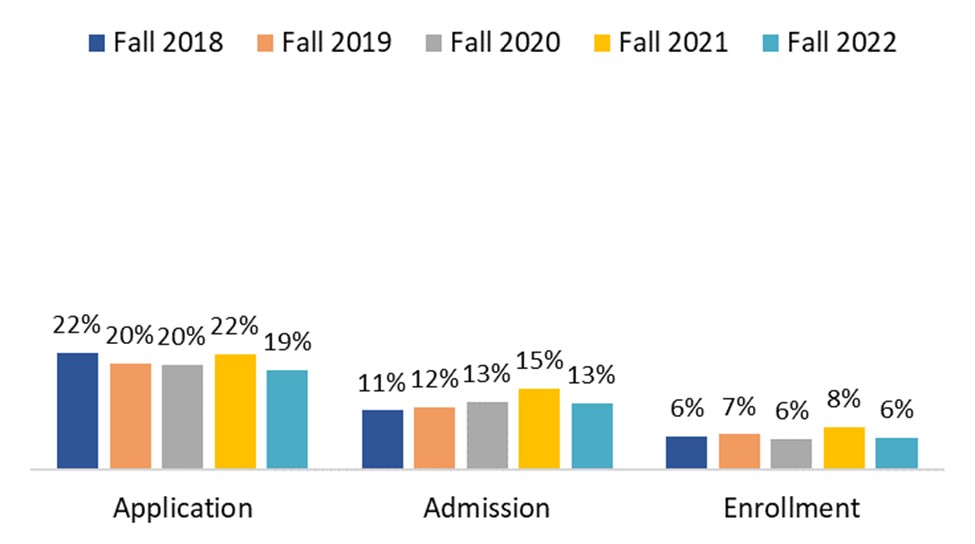
GEAR UP High Schools’ UC Application, Admission and Enrollment Rates

Three bar charts, each with values for Fall 2018, Fall 2019, Fall 2020, and Fall 2021. The application chart's percentages were 22% for 2018, 20% for 2019, 20% for 2020, and 22% for 2021. The admission chart's percentages were 11% for 2018, 12% for 2019, 13% for 2020, and 15% for 2021. The enrollment chart's percentages were 6% for 2018, 7% for 2019, 6% for 2020, and 8% for 2021.

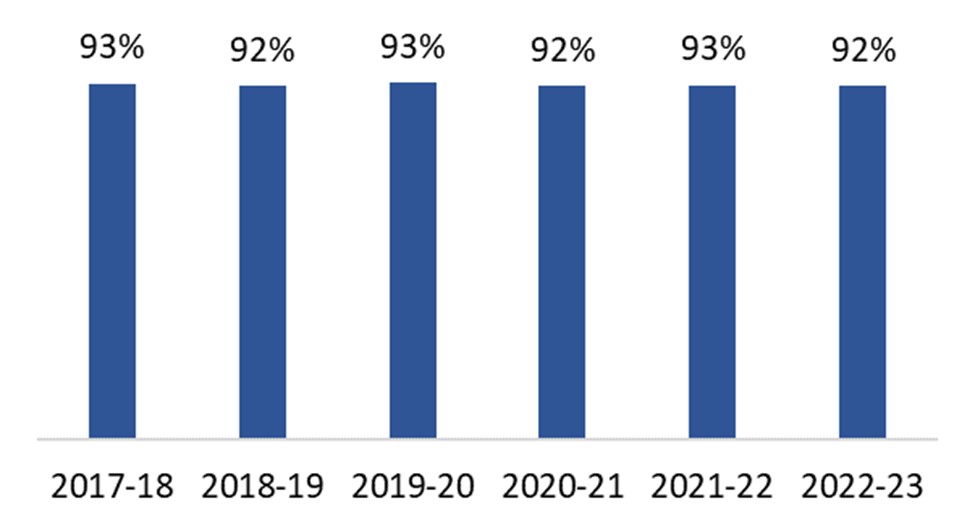
GEAR UP High Schools’ Graduation Rate

One bar chart showing values of high school graduation rates between the 2017-18 and 2021-22 school years. The 2017-18 percentage was 93%. The 2018-19 percentage was 92%. The 2019-20 percentage was 93%. The 2020-21 percentage was 92%. The 2021-22 percentage was 93%.

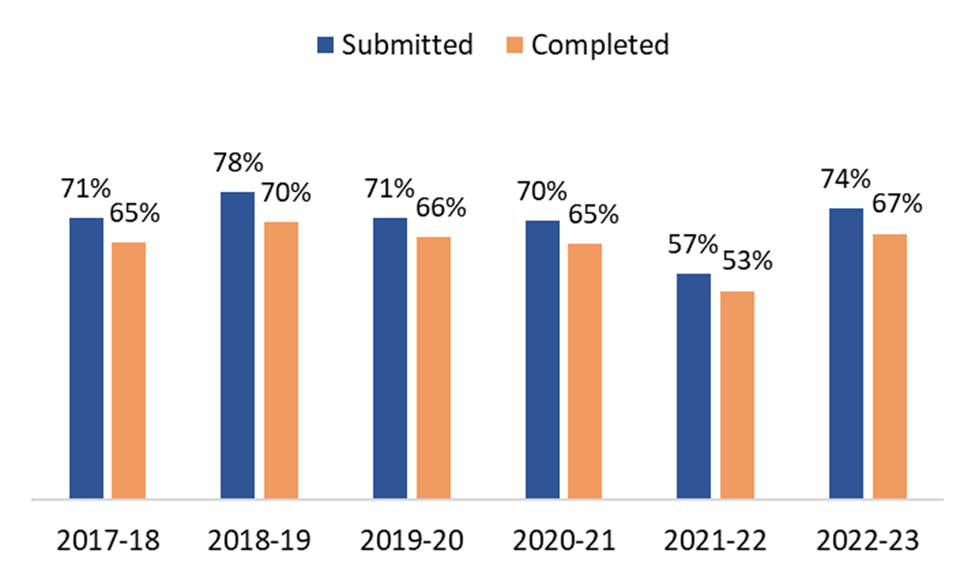
GEAR UP High Schools’ FAFSA Submission and Completion Rates

Five bar charts, each with values for FAFSA submission and FAFSA completion rates between the 2017-18 and 2021-22 school years. The 2017-18 chart's percentages were 71% for submission and 65% for completion. The 2018-19 chart's percentages were 78% for submission and 70% for completion. The 2019-20 chart's percentages were 71% for submission and 66% for completion. The 2020-21 chart's percentages were 70% for submission and 65% for completion. The 2021-22 chart's percentages were 57% for submission and 53% for completion.
Note. A FAFSA application can be submitted but later rejected (i.e., not completed) due to missing critical pieces of information.

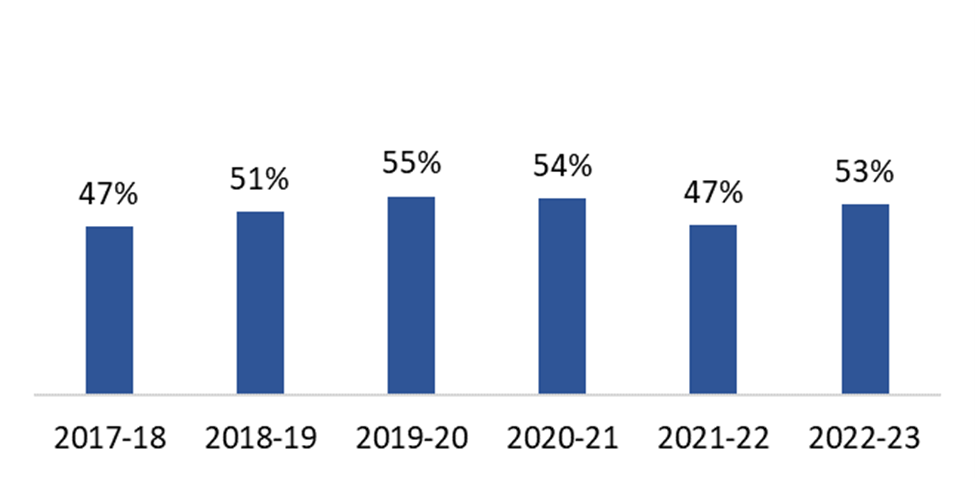
GEAR UP High Schools’ Rates of Students who Met the CSU and UC A-G Course Requirements

One bar chart showing the percentage of high school students who met the CSU and UC A-G course requirements between the 2017-18 and 2021-22 school years. The 2017-18 percentage was 47%. The 2018-19 percentage was 51%. The 2019-20 percentage was 55%. The 2020-21 percentage was 54%. The 2021-22 percentage was 47%.

GEAR UP Schools’ CAASPP Math and English Language Arts Proficiency Rates

(Average of Grades 6th, 8th, and 11th)

Six bar charts, each with values for the percentage of students who scored at or above proficiency on the CAASPP math and English language arts assessments between the 2016-17 and 2021-22 school years. The 2016-17 chart's percentages were 20% for math and 42% for English language arts. The 2017-18 chart's percentages were 19% for math and 42% for English language arts. The 2018-19 chart's percentages were 21% for math and 45% for English language arts. Percentages for 2019-20 are not at available due to the COVID-19 pandemic and no testing. The 2020-21 chart's percentages were 16% for math and 41% for English language arts, however, there was limited testing during the 2020-21 school year due to the COVID-19 pandemic. The 2021-22 chart's percentages were 16% for math and 39% for English language arts.

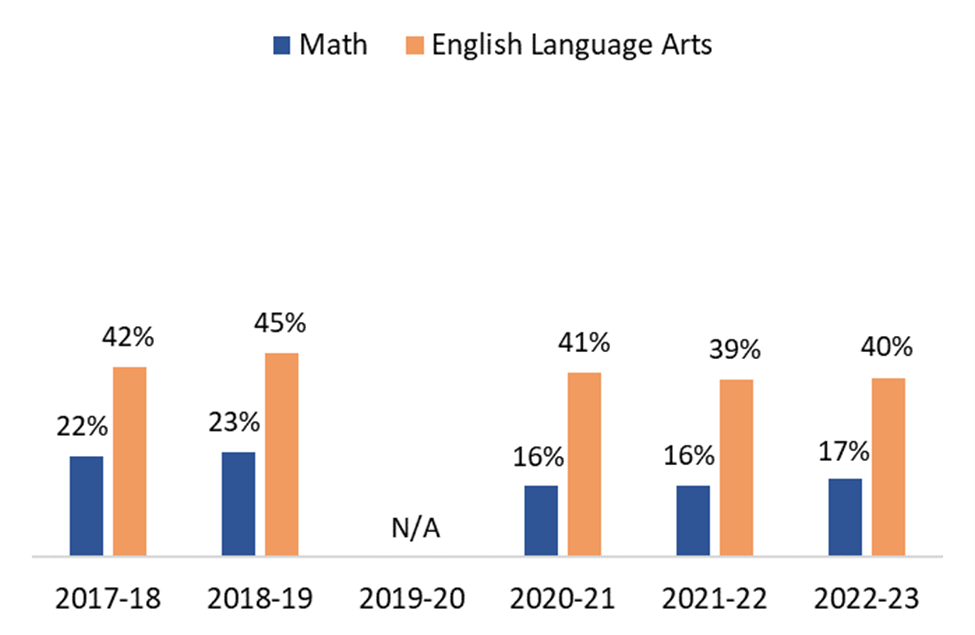
Note. Rates represent school-level percentages of students who scored at or above proficiency on the CAASPP math and English language arts assessments. Due to the COVID-19 pandemic, there was no testing in 2019-20 and limited testing in 2020-21.